Often in the field, the cost to collect all the information for a particular area can be very costly in both time and fiscal cost. To combat this, the method of sampling is used as a shortcut to achieving successful spatial analysis while saving cost and time. For this exercise our class was given the task to collect topographic data for sandbox. The sandbox topography was created by each of the classes individual groups. Sampling can be conducted in three main methods 1) random, 2) systematic and 3) stratified. Of the three sampling methods, random sampling produces the least amount of user bias as each sample of a given population has an equal chance of being selected and is selected at random. Problems with random sampling method is that certain portions of the population are not included in the survey resulting in error. Stratified sampling consists of a population being divided into proportional categories based upon similar characteristics or zones. Systematic sampling is conducted in an organized structure such as a coordinate grid to collect samples at equal intervals. This can lead to errors as areas that do not correspond to grid intervals will not be sampled. The purpose of this lab is to create a topographic profile that will be used later to create a digital terrain model (DTM).
Methods
After weighing the pros and cons of the three sampling methods our group decided to use the systematic point sampling method. The reason we chose to conduct our survey using the systematic method was because we could divide the sample into an evenly spaced grid allowing for the survey to be consistent throughout the survey.
To conduct our survey we used the following materials: sandbox filled with sand, yarn, pushpins, a meter stick, field notebook, pencil and a tape measure (Figure 1.). The inside dimensions of the sandbox measured 114 cm by 114 cm and push pins were placed every 6 cm around the sandbox resulting in 19 evenly placed markers on each side of the box. Once the pins were put into place, we then designed the topography of the sandbox creating multiple features such as a ridge, valley and plane.
 |
| Figure 1 A tape measure, pushpins, field notebook and meter stick were used to complete the survey |
To conduct our systematic sampling of the sandbox, we created a coordinate system using strings yarn attached to pins spaced every 6 cm to create our X lines (Figure 2). We used a measuring tape to create a straight line for the Y lines as we conducted our survey. The measuring tape was moved further down the grid as the survey was being conducted. We then took elevations measurements (Z) every 6 cm along the Y lines using a meter stick where the X lines intersected the Y lines. The height of the yarn across the grid was our measuring point for the elevation.
 |
| Figure 2 Our grid created for our systematic sampling method. Yarn was placed for the X lines spaced every 6 cm. A tape measure (lower right) served as our Y line and was moved throught the grid as we progressed through the survey. |
The data was then recorded into a field notebook noting each points X and Y location their corresponding Z values. Once all sampling points were collected they were imported into excel.
 |
| Figure 3 Displays the collected elevation measurements along with their corresponding location with in the grid |
Results
We collected a total of 401 sampling points throughout the sandbox where the X and Y lines intersected. Using excel we then calculated the maximum elevation (lowest point), minimum elevation (highest point), mean and standard deviation of the sample (shown below).
Standard Deviation: 2.3874
Mean: -5.9325
Max: -12.5
Min: 0
Standard Deviation: 2.3874
Mean: -5.9325
Max: -12.5
Min: 0
Using the systematic sampling method, we were able to create an equal interval grid system that allowed for us to collect a large amount of sample points in an organized manor. This made the final results of the sample to be organized in a clear and simple layout (Figure 4.). Using this method alone did however leave some areas with the grid to not be sample as we collected Z values at the corners of the grid. This left areas between the intersections of the grid to be left unsampled. This sample could have been aided through the use of a stratified system in areas of uniformity and sharper elevation change in order to achieve higher levels of accuracy. Along with the lack of multiple methods being used, we also had errors in our elevation data due to the meter stick sinking into the sand when measuring, leading to errors that varied from about 1-2 cm.
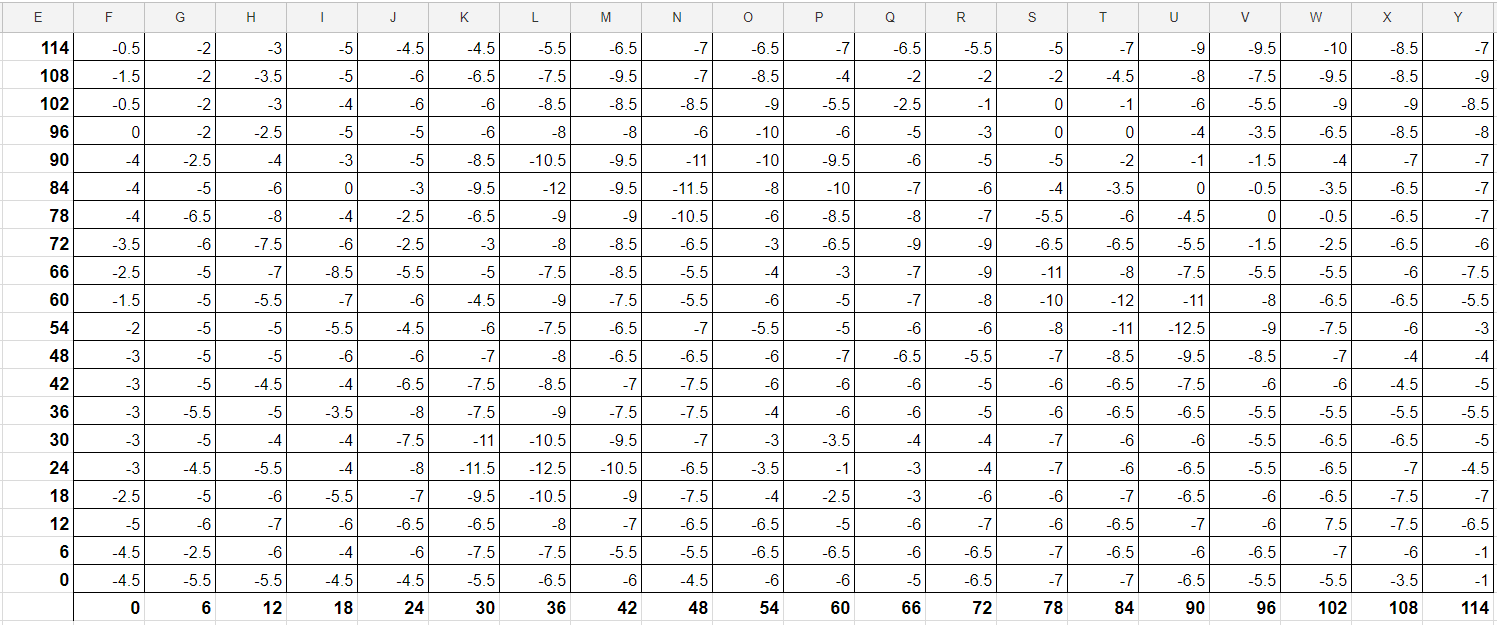 |
| Figure 4. The table displays the elevations of different sample points and their locations throughout the sample grid. |
Conclusions
The sampling used in the lab relates to the definition of sampling because points were collected in locations specified by a grid system placed over the survey area. This acted as a shortcut in our survey as points weren't collected for every location in the sandbox. Using sampling in a spatial situation allows for the surveyed area to be conducted in a timely manor. It would be impossible to collect data points everywhere within the sandbox and would consume extraordinary amounts of time and effort. This relates to sampling of larger spatial areas because surveyors in the field do not have the time nor the budget to collect survey points at every location within their fields of study which often far exceed the scale conducted in this exercise. To improve the resolution of our sampling a decreased our sampling interval from every 6 cm to every 3 cm could have been used and would have created a survey with a higher point density.
No comments:
Post a Comment